October 18, 2019 - by Valentina Tamburello
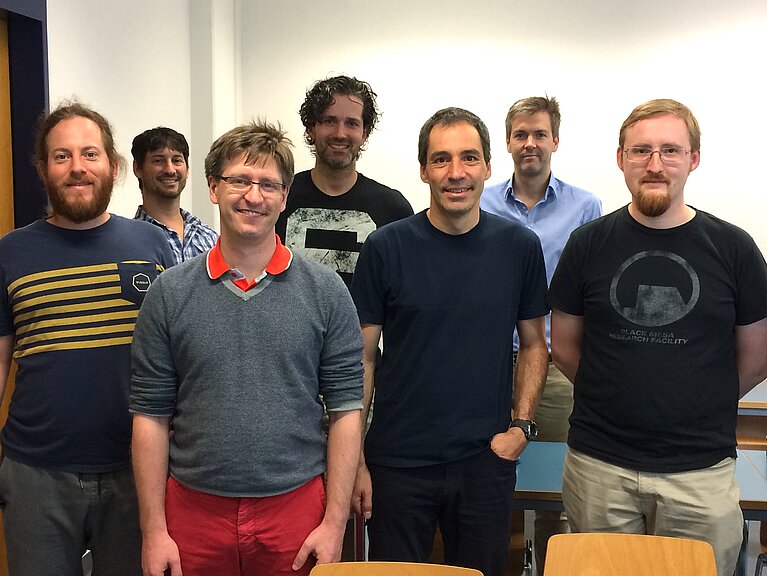
The University of Bern has recently organized a workshop about Elasticsearch, Graylog, Grafana and Kibana that was held by our colleague, Dino Conciatore. Dino, indeed, successfully uses these products for the CSCS Centralized logs and metrics collector and visualization infrastructure, since more than 3 years. In this interview, he tells us something more about his work.
Hi Dino, what is your role at CSCS?
I am System engineer in the HPC Operations unit
What do you do exactly?
I take care of LHC Services, logs and metrics collector and visualization infrastructure (Elasticsearch, Graylog, Grafana, Kibana), Central Slurm database, Configuration Management (Puppet)
How did you start using these products (Elasticsearch, Graylog, Grafana, Kibana)?
Initially, I wanted to monitor the LHC services (Phoenix Cluster) which have a total of 160 machines so a small collection and visualization infrastructure was enough.
Considering the potential, it was decided to extend the cluster in order to monitor, collect logs and metrics from all the CSCS machines.
What are the advantages of this technology?
As the complexity of systems increases and the scale of these systems increases, the amount of system level data recorded increases. Therefore, managing the vast amounts of logs and metrics data is a challenge that CSCS solved with the introduction of a centralized log and metrics infrastructure based on Elasticsearch, Graylog, Kibana, and Grafana. This is a fundamental service at CSCS that provides easy correlation of events bridging the gap from the computation workload to nodes enabling failure diagnosis. Currently, the Elasticsearch cluster at CSCS is handling more than 30 billions of online documents (in one year) and another 40 billions has been archived. The integrated environment from logging and metrics to graphical representation enables powerful dashboards and monitoring displays.
Why the University of Bern was interested in such a workshop?
After some discussion during a meeting, Sigve Haug (ScITS, responsible) asked me to prepare this workshop in order to explain to other System Engineers from others institutes how to setup from scratch a logs and metrics collector and visualization cluster and also share our know-how at scale in order to properly size future implementations.
Which topic did you cover?
- Description of the CSCS infrastructure
- Installation/Configuration of all the components of the cluster in a Virtual Environment
- Sending Logs and Metrics from the Virtual Nodes
- Doing some basic queries
- Creating Dashboards
What is your feedback about this workshop?
I am very happy because for me was the first time preparing a workshop and teach to others and the feedbacks were positive.

