January 19, 2016 - by Simone Ulmer
Stomp, please! That is the request in Focus Terra, the Earth Sciences Museum of ETH Zurich. A nearby seismometer instantly measures the seismic waves triggered by the shock as they pass through the floor. If those seismic waves are powerful enough – from an earthquake, for example – they can propagate to all corners of the globe. From the seismometer data, seismologists aided by supercomputers are seeking to create with maximum accuracy a three-dimensional tomographic image of the Earth’s crust and interior similar to a computed tomography for a human being. Such images of Earth’s interior are capable of revealing geological deposits, or the reservoir of a volcano.
Seeing and monitoring geological deposits
Seismologists observe the underground using seismic waves generated by man-made explosions or natural shocks. The most obvious natural sources are earthquakes. But there also exist weak, continuously active sources of seismic waves, which are registered by seismometers as steady background noise. This data can be used, for example, to monitor day-to-day development of an oil-producing petroleum reservoir, says Andreas Fichtner, professor at the ETH Institute of Geophysics.
One challenge is that some of these natural sources shift position daily. “This movement of the sources means that we ‘see’ the subsurface differently each day”, says Fichtner. So it is not absolutely clear what has changed: the reservoir, or just the image of the subsurface.
So Fichtner and his team developed a numerical method to accurately monitor the subsurface. With it they sought to identify the positions of the seismic sources and thus eliminate errors in the tomographic imaging. Almost incidentally, the researchers gained amazing insights into those sources along with new information concerning the origins of seismic background noise.
Ten years in one-second intervals
The researchers used this new method on the Piz Daint supercomputer to process an enormous data set obtained from 100 seismometers situated all over the world. The seismometers recorded every ground movement around the Earth at intervals of one second over a ten-year period. From these, the scientists used the seismic background noise generated by two different kinds of seismic wave from continuously active sources. Both are weak: they cause ground movements of just a few micrometres, imperceptible to humans. There is one wave oscillating at higher frequencies, with short periods ranging between 7 and 14 seconds. The result is a sort of whistle, called ‘noise’. The other wave oscillates at low frequency with long periods of 100 seconds or more and is called ‘hum’.
“The hum acts like a low-pitched bell that swings steadily from constant striking”, says Fichtner. Its oscillation periods are so long that the whole Earth, which has a volume of one trillion (ten followed by 21 zeroes) cubic metres and a mass of 6 trillion kilograms, is made to oscillate.
The researchers then correlated each individual seismometer record with those of all the others. “With such minuscule waves, we need huge amounts of data in order to obtain statistically significant results”, Fichtner notes, “and that would not be doable without supercomputers.” From the resulting correlation functions they finally calculated the distribution of noise sources and hum sources. “Simply put, we were able to reconstruct the sources from differences between the amplitudes recorded by the seismometers”, says Fichtner.
Seasonal migration
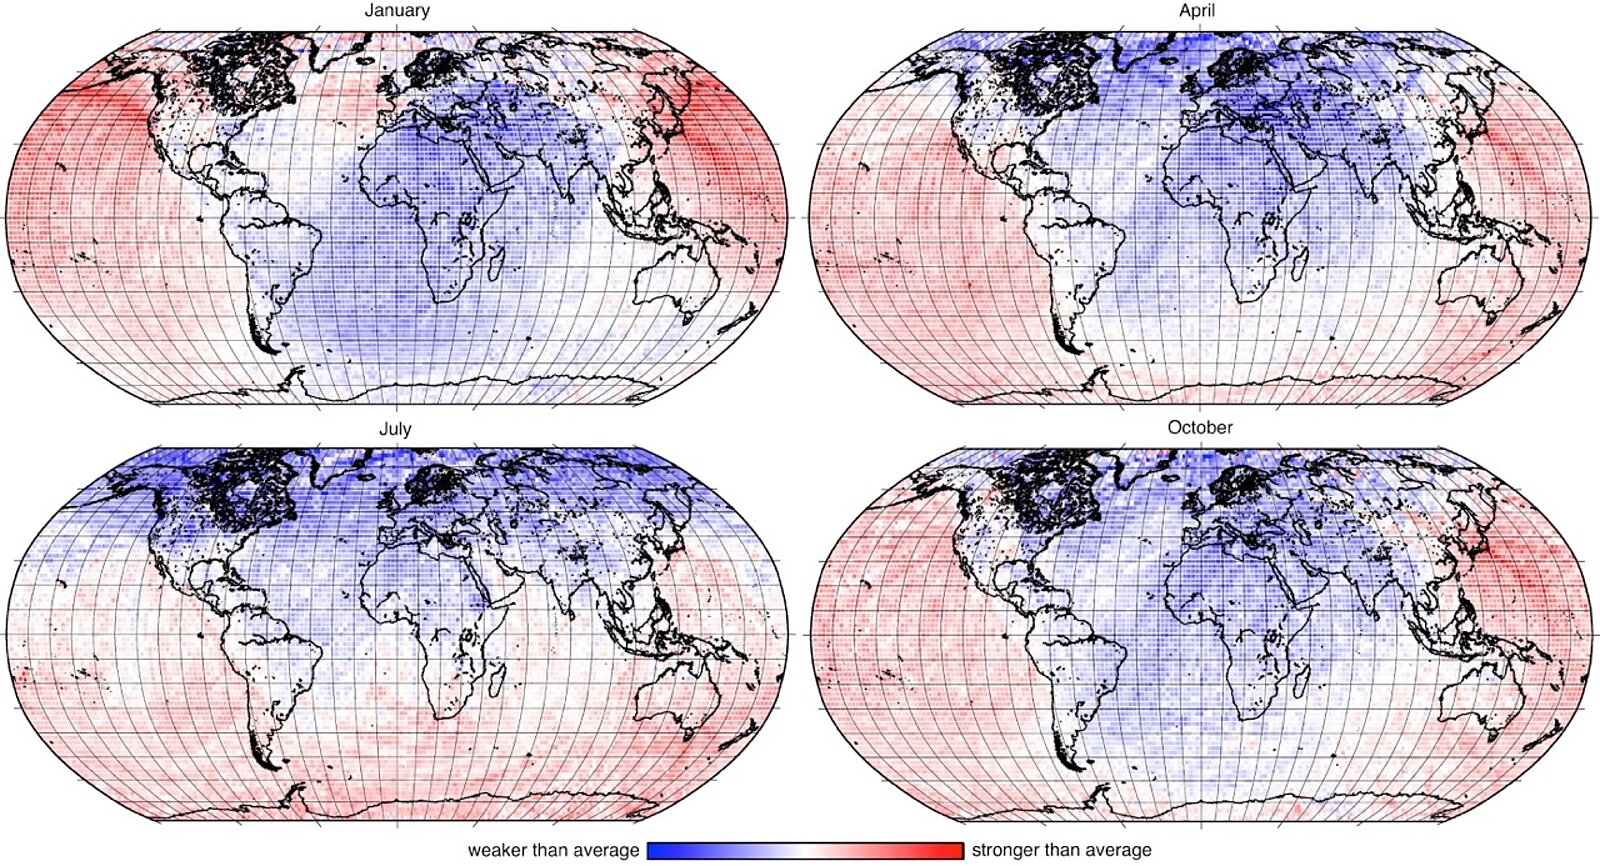
After the supercomputer had calculated the positions of the hum sources, the scientists printed monthly maps of them. Surprisingly, not only did a certain order emerge from the chaos, but there was also a strong year on year resemblance between the maps for each month, says Fichtner.
As shown by a previous study, the hum and noise sources migrate with the seasons. Now for the first time the researchers were able to show that the hum sources are unevenly distributed: they are stronger in the oceans – especially the Pacific – than on the continents. Exceptions are strong continental sources in East Asia and Australia, and weak ones in the Atlantic, the researchers write in their study that was published in the Geophysical Journal.
It has been known for about a decade that the noise comes from the ceaseless swell of the world’s oceans, like a seismic source rocking the seabed. Indeed if you stand on a beach and observe the waves, they hit the shore at intervals between 7 and 14 seconds, says Fichtner.
Just how the hum arises is not yet clear. It is thought that such signals could be generated when ocean waves with long periods meet continental slopes or pass by oceanic obstacles. But also up for discussion is atmospheric turbulence and wide-area fluctuations in air pressure, which create a resonance between the atmosphere and the ground, which is perceived as hum. “Our study shows no clear signature for either ocean or continent”, Fichtner notes. So for the researchers it is evident that the origin can neither be purely oceanic, nor purely continental, and that in turn could speak for an atmospheric effect.
Looking ahead, the earth scientists want to include much more data and thus refine the method. It does not currently take into consideration the Earth’s three-dimensional structure, since the method and its underlying theory were intentionally very much simplified. But using the new method, and taking into account the exact positions of the seismic sources, the scientists can nevertheless rapidly create a more accurate picture of our planet’s subsurface.
Reference
Ermert L, Villssenor A, & Fichtner A: Cross-correlation imaging of ambient noise sources, Geophys. J. Int. (2016) 204, 347–364, doi: 10.1093/gji/ggv460