March 18, 2014 - by Simone Ulmer
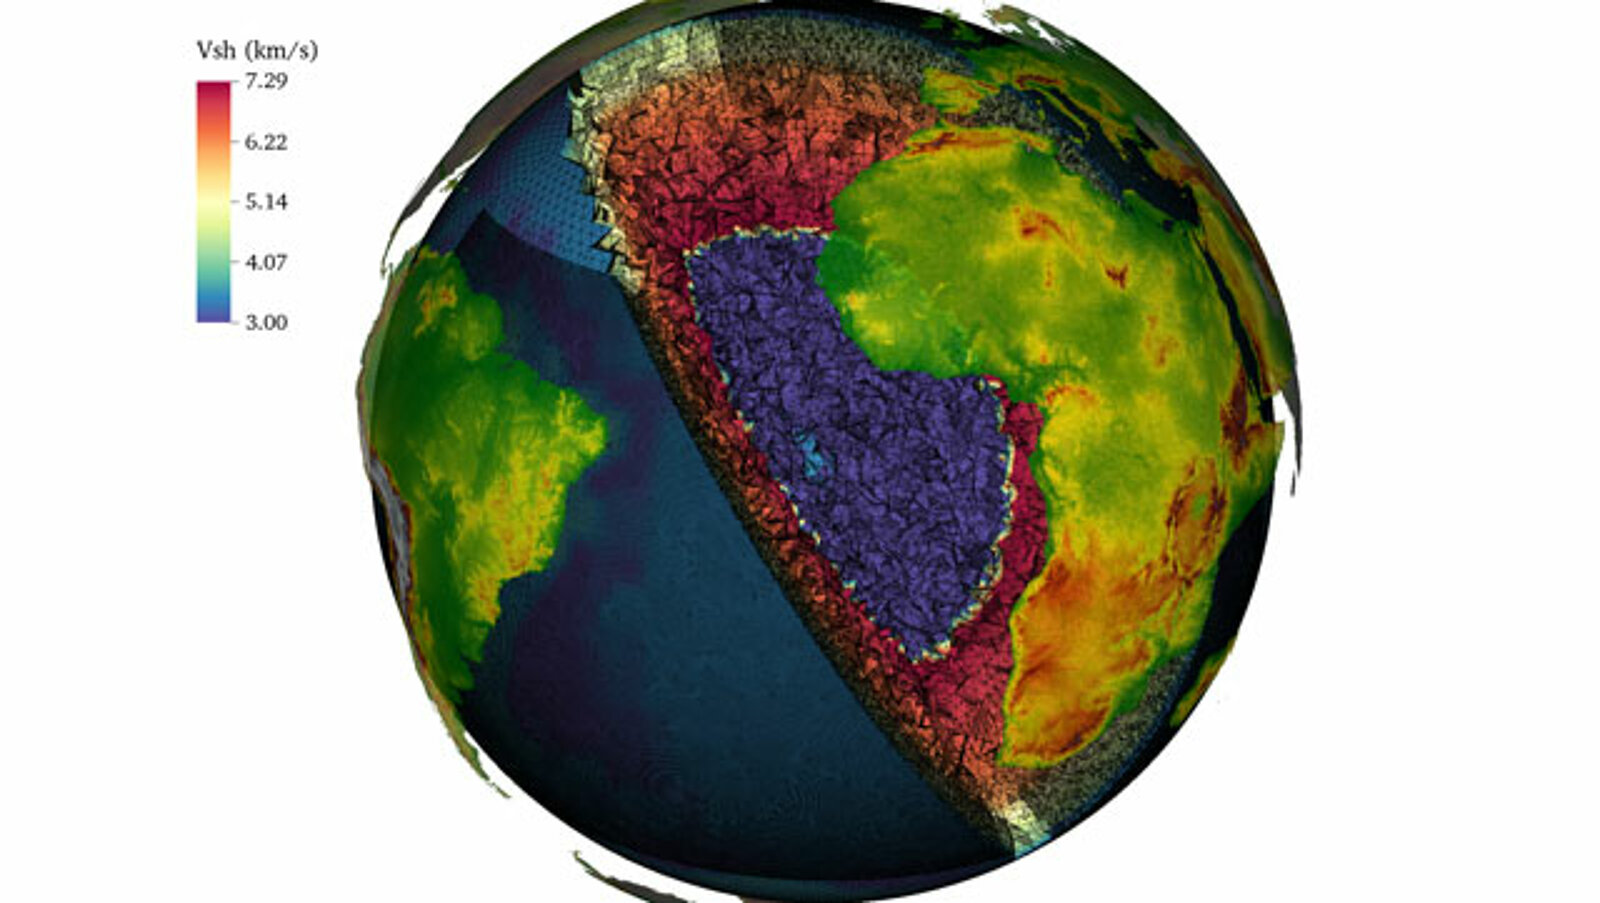
Seismic waves act like a form of x-radiation. Generated through tremors such as earthquakes or explosions, they pass through the Earth’s crust and mantle. Their speed, which is registered on seismograms, changes at transitions between layers of different materials. Based on these changes in the time required for the seismic waves to pass through the rock, the structure of the Earth’s interior can be mapped.
Geophysicists simulate earthquakes and their seismic waves in order to explain the seismograms. This gives them a three-dimensional tomographic image of the Earth's mantle and crust, which in turn enables them to draw conclusions as to where and how much the ground moves vertically in the event of an earthquake, for instance. This information is used, for instance, for earthquake engineering in city planning. However, tomographic images also reveal structures in the Earth’s crust, provide evidence of potential oil and mineral deposits and are able to display medium-term changes in the surface topography caused by processes inside the Earth.
New methods and hybrid computers as accelerators
However, the step from a tomographic image of the Earth’s interior to a quantitative statement is a large one, says ETH Zurich professor and geophysicist Andreas Fichtner. While he prefers to solve mathematical seismic problems with brainpower and a pen and paper, he says, these tools are nowhere near powerful enough to help him reach his research goal of mapping the Earth three-dimensionally in high resolution. For such complicated simulations, Fichtner relies on the world’s most powerful supercomputers. Using a new simulation method he developed with geophysicist Yann Capdeville and the hybrid supercomputer “Piz Daint” at the Swiss National Supercomputing Centre (CSCS), he can move one step closer towards his goal.
For a tomographic image, says Fichtner, it is not only important to use the speed of the waves, but also all the oscillations and information of a seismogram. In order to be able to simulate the complex data, the physical wave equation needs to be solved approximately. This connects the Earth’s structure, with its chemical and physical properties such as density and elasticity, to the earthquake source and the seismic wave field that has been measured. Only then, he says, can unknown factors such as density distribution in the Earth’s mantle or hitherto unfathomed processes that take place inside it be explained based on the simulations. “We would like an Earth model that enables us to look 2,500 kilometres into the mantle so that we can study the source regions of mantle plumes”, says Fichtner. Plumes are mushroom-like formations inside the Earth consisting of hot rock material rising up from the depths of the Earth’s mantle.
It should also be feasible to use the model to study the lithospheric structure of the Alps just as effectively, which is not possible using the methods currently available. Although there are decent models of the Alps, they are virtually disconnected from the effects that their direct surroundings have on them.
Combining different scales
In order to simulate a local region of the crust and the Earth’s mantle three-dimensionally on the one hand and calculate the continent belonging to the region on the other, different scales need to be factored into the model. Unlike large areas, the researchers require short wavelengths with high frequencies to depict local areas inside the Earth, for which they have a large amount of seismic data. If the frequency doubles, the wavelength is halved. This means that the intervals of the grid into which the region is divided need to be much smaller in order to prevent the wavelengths – and with them the information – from falling through the grid. As a consequence, the calculations are more complex, take longer and are thus more costly.
The complex mathematical method of multiscale full waveform inversion developed by Fichtner and Capdeville helps alleviate this problem by solving two problems instead of only one. “Only thanks to this method are such simulations even possible with today’s computers”, explains Fichtner. However, they remain highly computationally intensive. “Piz Daint” has another advantage here, as the graphics processors accelerate the calculations fivefold.
“Google Earth interior”
Until now, the Earth’s interior has been calculated approximately through inverse modelling, where a synthetic seismogram is simulated based on the running speed of a real seismogram. The differences in the waveform of the synthetic seismogram are then compared with the real seismogram. By adjusting the model parameters of density and elasticity, the synthetic seismogram is gradually matched to the real seismogram. The new method uses this procedure too, but it allows the researchers to remove a computationally intensive zone from a continent like a Lego brick once it has been calculated. The results are scaled up to the surrounding continent, which is then calculated with larger grid intervals and low-frequency seismic waves. The “Lego brick” is then reinserted and the entire continent is simulated with low-frequency seismic waves. “This gives us a model that not only enables us to map the crust and the Earth’s interior three-dimensionally, but also zoom in on both”, says Fichtner.
Surprising insights into the Earth’s interior
Using this method, Fichtner and his team were able to demonstrate that there is another plume besides the known Iceland plume beneath Iceland in the North Atlantic: the Jan Mayen plume. The simulations also revealed that hot mantle material in the lithosphere (oceanic crust and parts of the upper mantle) flows from the Jan Mayen plume1 towards Scandinavia and Great Britain in a finger-like manner and influences the continuous rising of these landmasses. They also managed to map in detail the subsurface structure of the North Anatolian Fault2, one of the most important and densely populated continental faults in the world. Now the team is ready to create the zoomable tomographic model of the Earth on “Piz Daint”. The groundwork for efficient use of the most powerful supercomputer in Switzerland was already laid during the Petaquake project within the scope of the High Performance Computing and High Productivity Computing (HP2C) platform. The necessary codes and algorithms were adjusted in such a way that they were able to use the full capacity of the graphics processors. The first tests on “Piz Daint” were completed successfully.
References
- 1Rickers F, Fichtner A & Trampert J: The Iceland–Jan Mayen plume system and its impact on mantle dynamics in the North Atlantic region: Evidence from full-wave form inversion, Earth and Planetary Science Letters (2013), 367, 39-51, doi.: 10.1016/j.epsl.2013.02.022
- 2Fichtner A et al.: The deep structure of the North Anatolian Fault Zone, Earth and Planetary Science Letters (2013), 373, 109-117, doi.:10.1016/j.epsl.2013.04.027